Every Place Looks Like Paradise Until You Check the Price
Hey, it’s Tortuga.
If you’re anything like me, every place I visit is the coolest place I’ve ever been. I immediately start looking at land. What’s for sale, what it costs, what a piece of this particular paradise would run me. And I’m shocked — genuinely shell-shocked — by the price. It doesn’t look like a million-dollar piece of property. It just is one. Then I go buy gas or grab groceries and the prices are multiples higher than what I’m used to at home. I retreat back to my little nook of the world, safe and comfortable, and tell myself it wasn’t meant to be.
That doesn’t stop the habit. The grass is always greener somewhere else — right up until I check the price.
So this time, instead of trusting my gut one more time, I decided to build the dataset and let it argue with me.
An Editorial Note, for Two Reasons
I want to be upfront about how this happened, because it matters for how you should read everything below it.
I did not walk into this with a hypothesis. I’ve got years of van-life experience and plenty of opinions about which states feel right — but I deliberately didn’t try to prove any of them. I graphed the data and let it tell me what it told me. I used the KISS method: no exhaustive statistical reduction, no cherry-picking variables until something interesting popped out. Just population, land, public-land share, cost of living, housing, taxes, health outcomes, and Trek4Free’s own catalogued outdoor opportunities — all on the same page, looked at plainly.
I’m also publishing exactly how I got these results, including the raw numbers, so you can fact-check every bit of it yourself. This is a first pass, not a final answer. Consider it version one of an idea, not a law of nature.
The First Lesson: Raw Totals Lie by Omission
Just counting outdoor destinations favors big, heavily-catalogued states. California and Oregon post enormous totals, but nobody experiences “2,000 opportunities” all at once. So this looks at three different views of the same data:
- Total opportunities — how much is there, period?
- Opportunities per 100,000 residents — how much exists relative to the people living there?
- Opportunities per 1,000 square miles — how concentrated and reachable is it geographically?
Those three questions can crown completely different winners. There is no single honest definition of “most outdoors.” A state can dominate one measure and be entirely ordinary on another.
Public Land Changes What “Access” Even Means
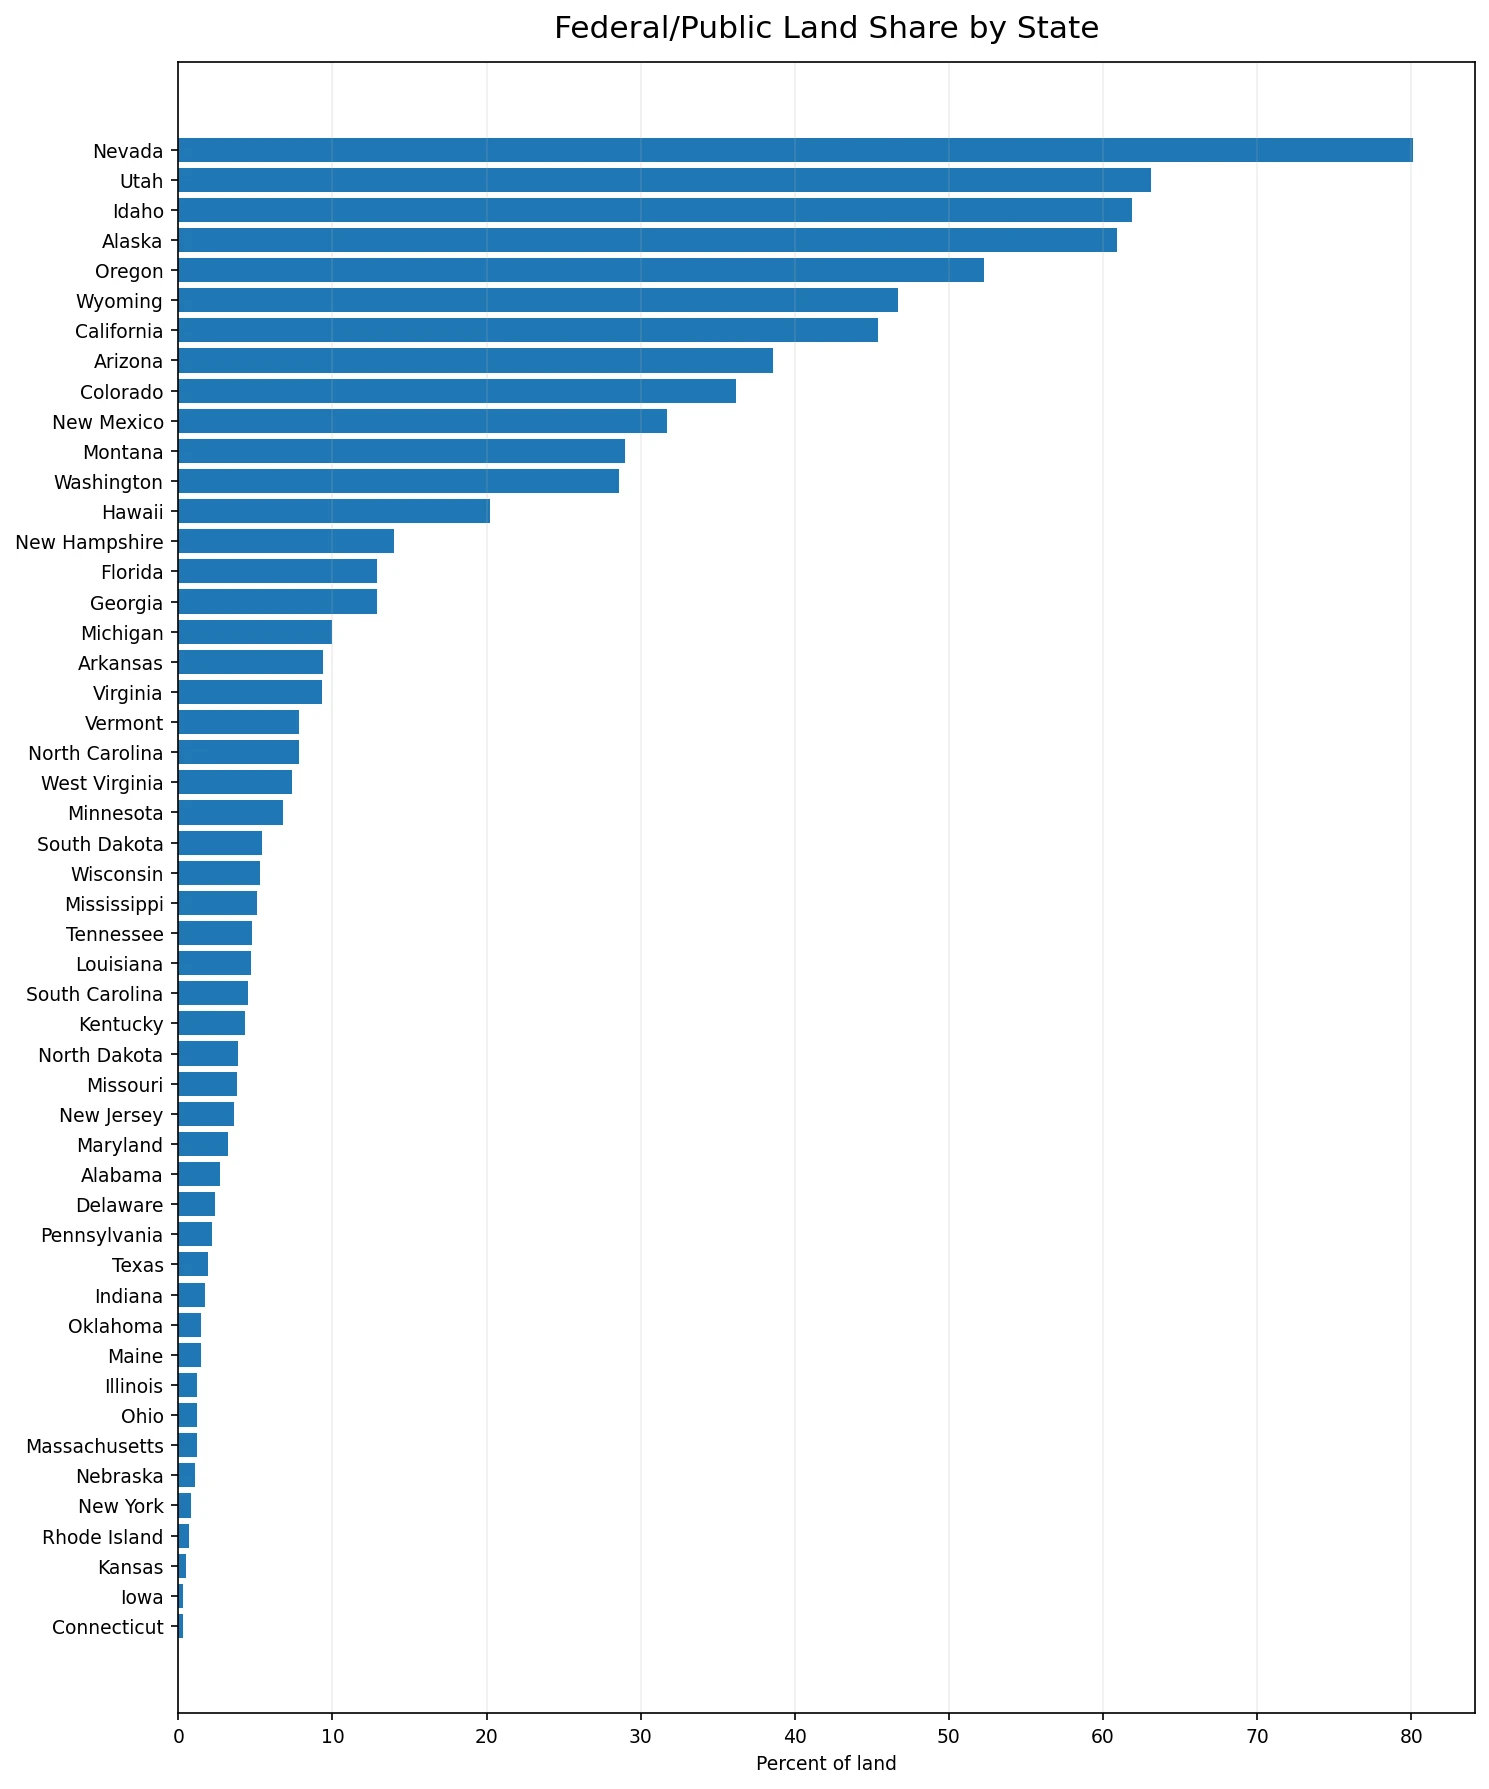
A developed campground is an outdoor opportunity. It is not the same kind of opportunity as a huge stretch of open public land where you can just go. So in this index, federal/public-land share gets the single largest weight — 25% — while developed campground counts stay in the raw inventory without earning a separate bonus.
That choice changes Texas’s whole picture. Texas has real outdoor recreation and a genuinely good state park system, but only 1.9% federal/public land in this dataset. Oregon has 52.3%. That gap captures something a campground count never will — and to be clear, it doesn’t prove Texas parks are overregulated or that one management model beats another. Reservation friction, fees, and dispersed-camping rules would need their own dataset before that claim could be tested. That’s a promising next step, not a conclusion I’m making here.
One number surprised me enough that I want to call it out directly: Nevada has the highest public-land share of any state in the country — 80% — and it still doesn’t crack the top 15 in the final ranking below. More public land doesn’t automatically translate into a high score if the cost of living is steep and the cataloged recreation density isn’t there. That’s exactly the kind of thing a single-variable “most public land!” ranking would have missed entirely.
Affordability Changes the Rankings Completely
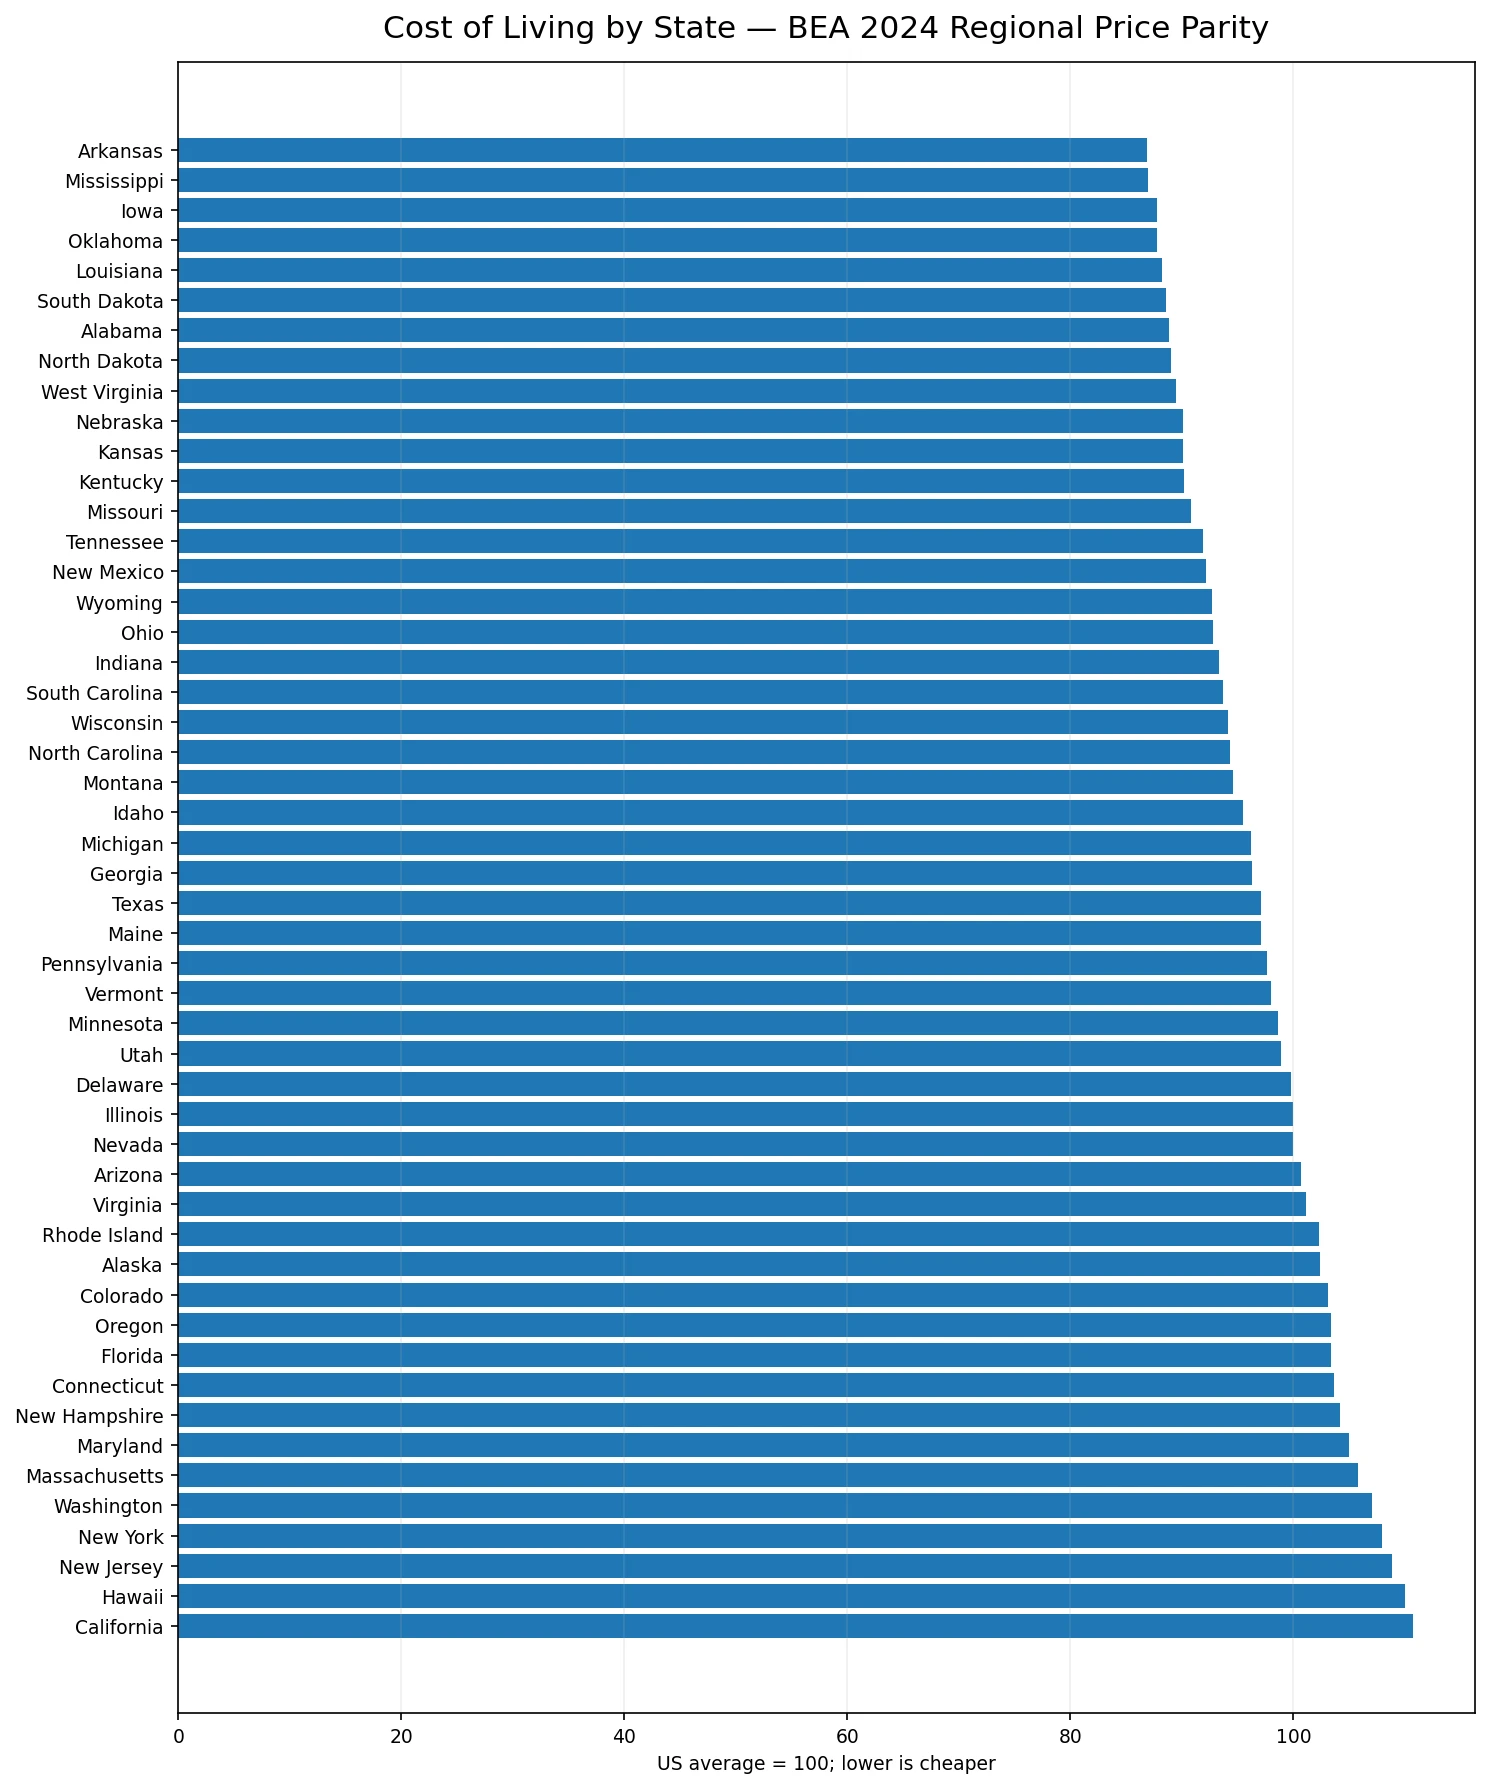
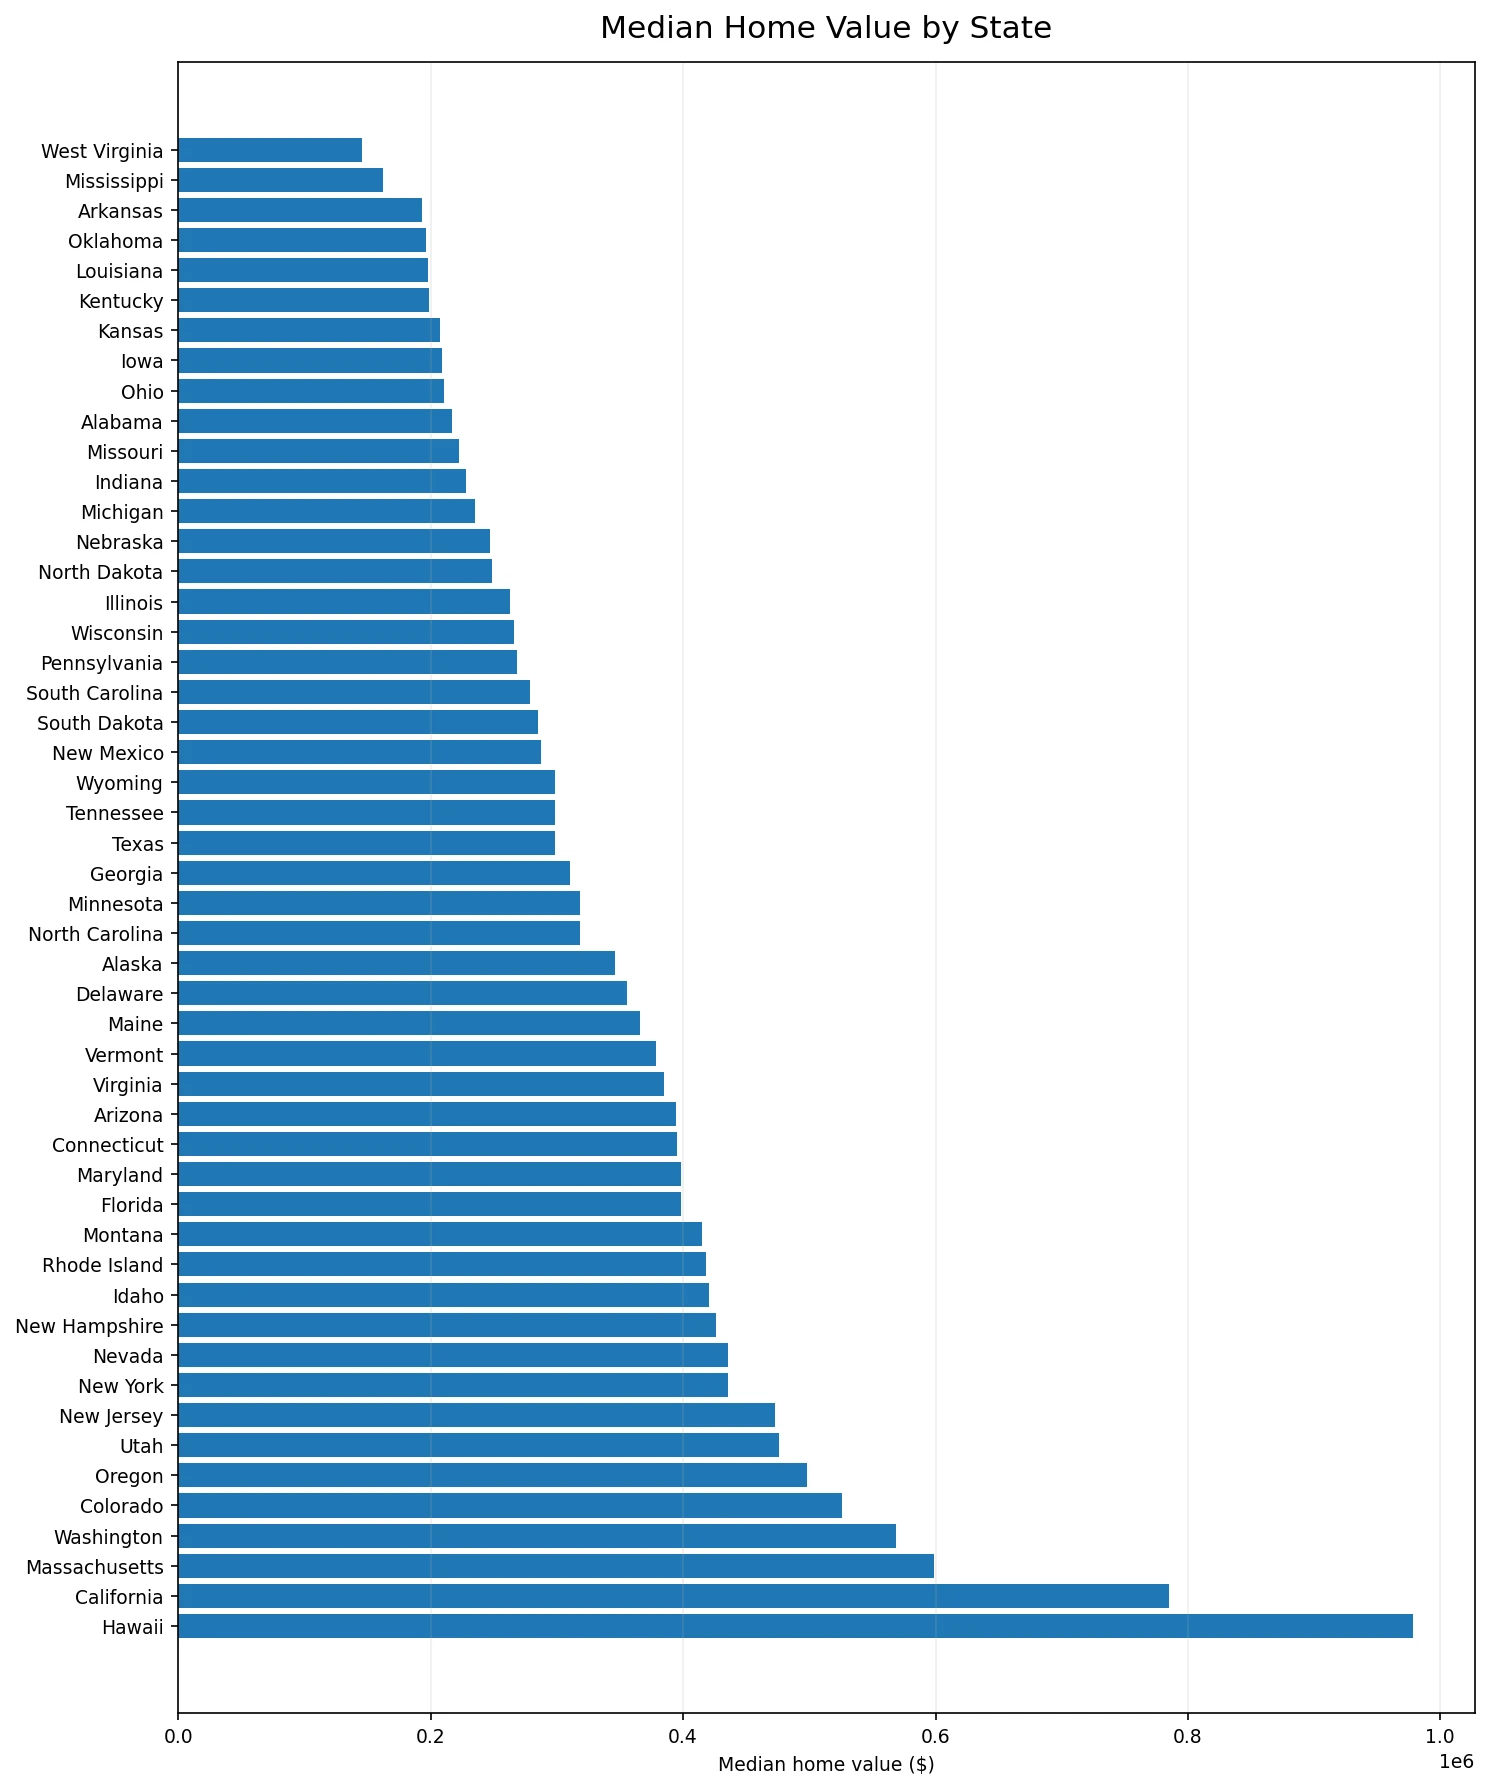
Once cost of living and housing enter the picture, the question stops being “where’s the best scenery?” and becomes “where can an ordinary person actually afford to build a life around this?”
Oregon is the clearest example of the tension. Its outdoor numbers are outstanding — that’s exactly its reputation. It still lands at #8 nationally with a score of 67.8, but its cost-of-living index runs 103.4 against a national benchmark of 100, and its median home value in this dataset is roughly $498,500.
Texas shows the opposite problem. Cost of living sits at 97.1, below the national benchmark, and median home value is around $298,700. Affordability genuinely helps Texas — it just isn’t enough to overcome low public-land share and thin outdoor-access numbers on its own.
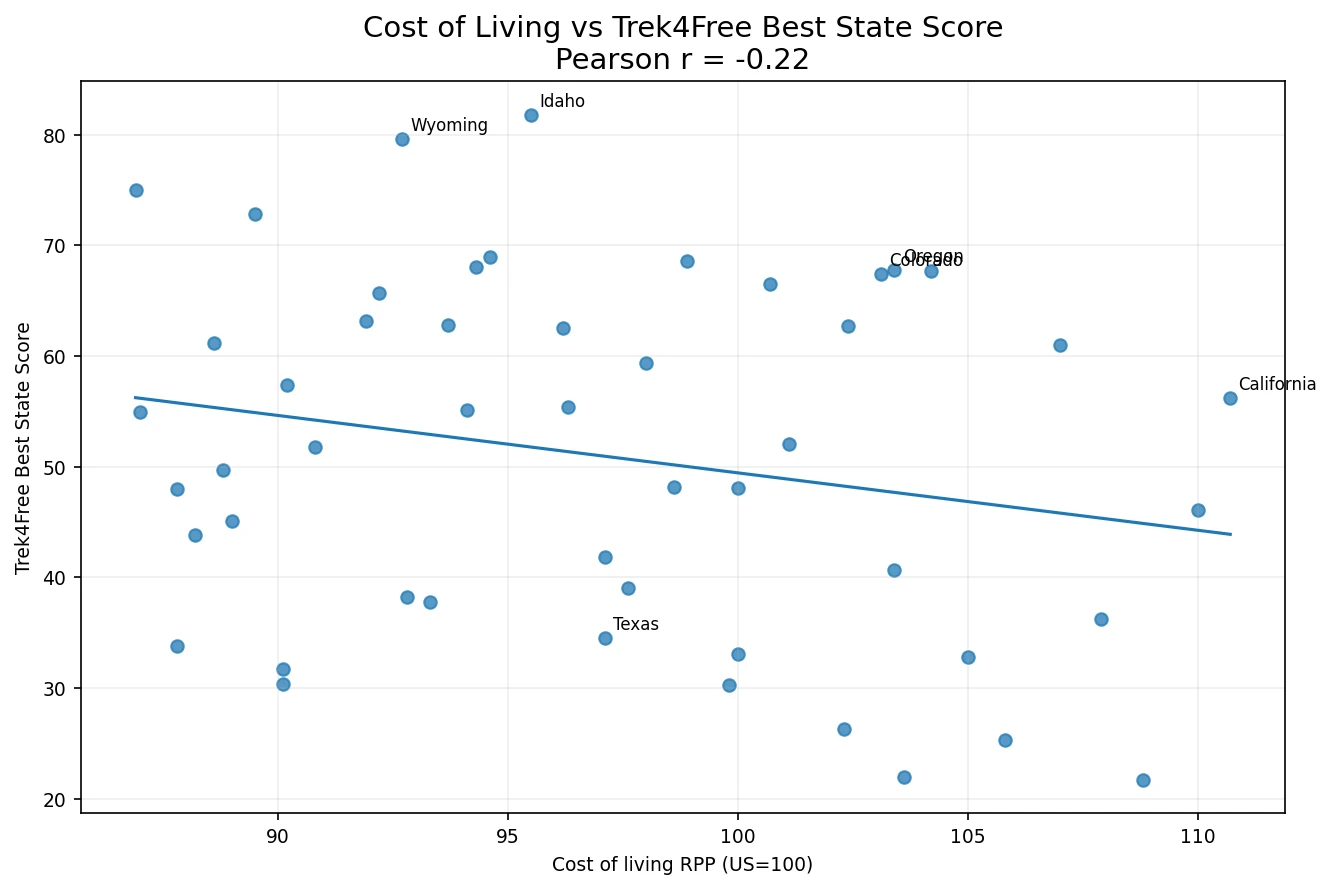
This is exactly why “best state to visit” and “best state to live” probably need to become two separate questions eventually.
The Trek4Free Best State Score v1
Here’s the whole formula, in the open. Each state gets percentile scores on eight measures, combined with these weights:
| Component | Weight | Direction |
|---|---|---|
| Federal/public-land share | 25% | More is better |
| Outdoor opportunities per 100,000 residents | 15% | More is better |
| Outdoor opportunities per 1,000 sq. mi. | 15% | More is better |
| Non-campground adventure abundance* | 10% | More is better |
| Overall cost of living | 10% | Lower is better |
| Median home value | 10% | Lower is better |
| Average two-bedroom rent | 5% | Lower is better |
| Total tax burden | 10% | Lower is better |
* Combined count of trailheads, swimming holes, waterfalls, and caves — kept separate from developed campgrounds so the score doesn’t just reward states that operate a lot of managed campsites.
Adult obesity is not part of this score. I treat it as a separate outcome to look at, not a measure of outdoor quality — more on why below.
The Ranking — and Some Real Surprises
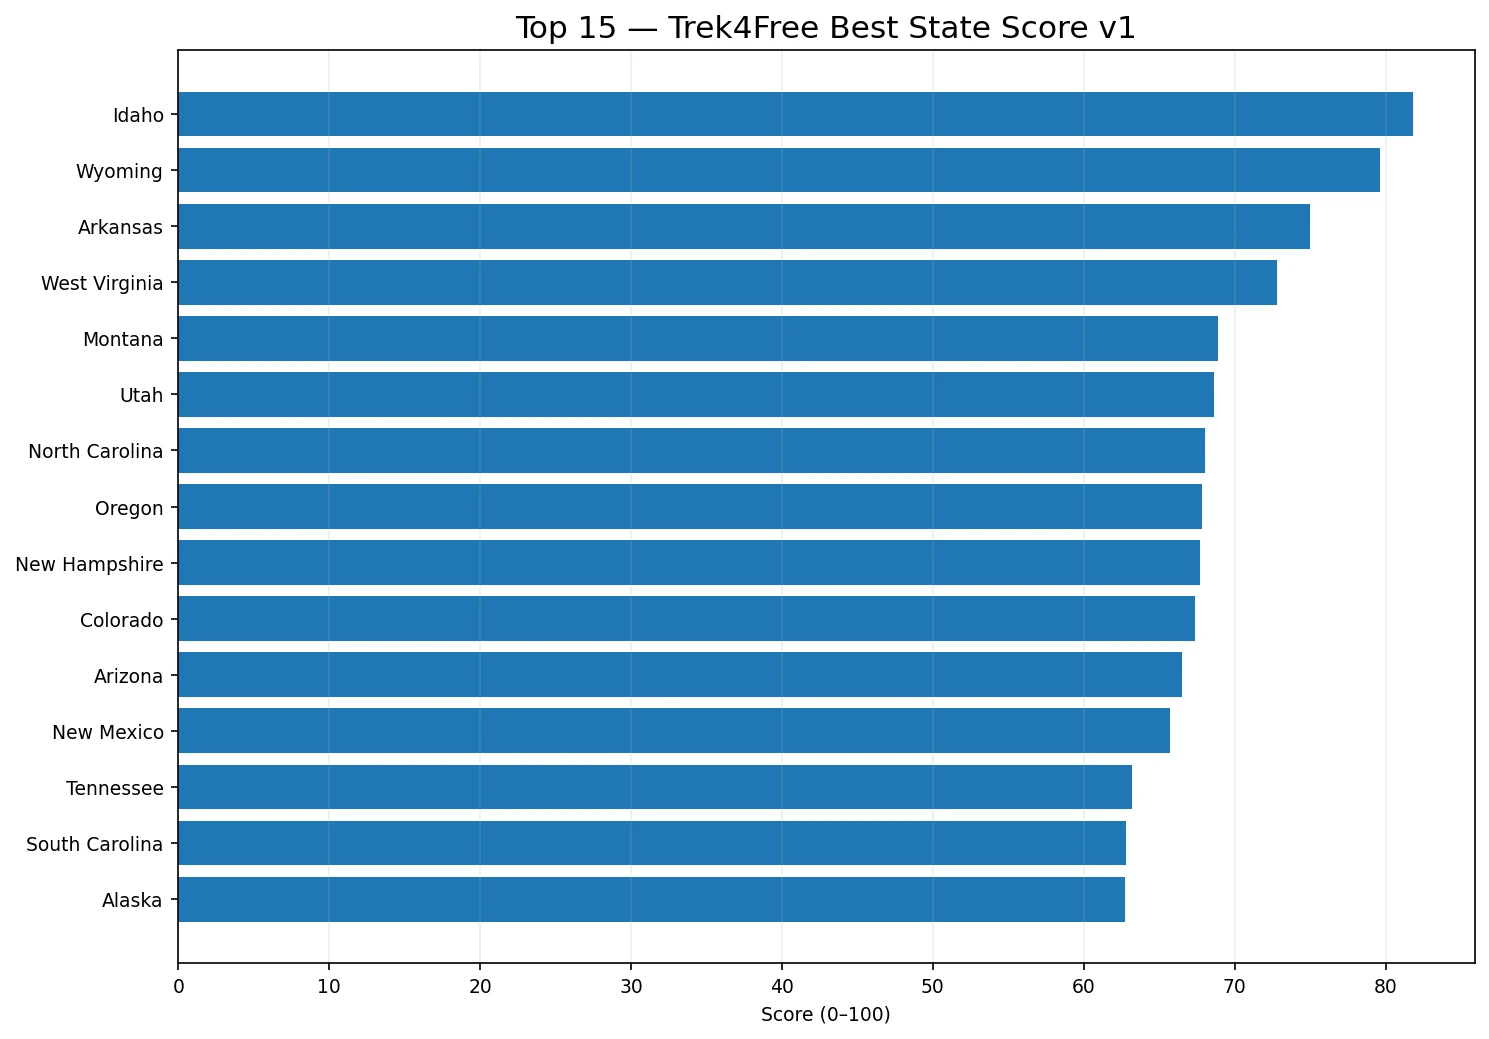
- Idaho — 81.8
- Wyoming — 79.6
- Arkansas — 75.0
- West Virginia — 72.8
- Montana — 68.9
- Utah — 68.6
- North Carolina — 68.0
- Oregon — 67.8
- New Hampshire — 67.7
- Colorado — 67.4
Idaho and Wyoming at the top made intuitive sense to me the moment I saw it — both combine huge amounts of public land with unusually high outdoor opportunity relative to their population.
Arkansas and West Virginia are the real story. Neither one shows up near the top of the glossy “best outdoor states” lists you’ll find everywhere else, and here they rank ahead of Oregon and Colorado. That’s not a flaw in the model — it’s the model measuring something genuinely different. This index rewards outdoor opportunity combined with affordability. It isn’t trying to find the state with the most famous national parks. It’s trying to find where an ordinary person’s outdoor life might actually be attainable.
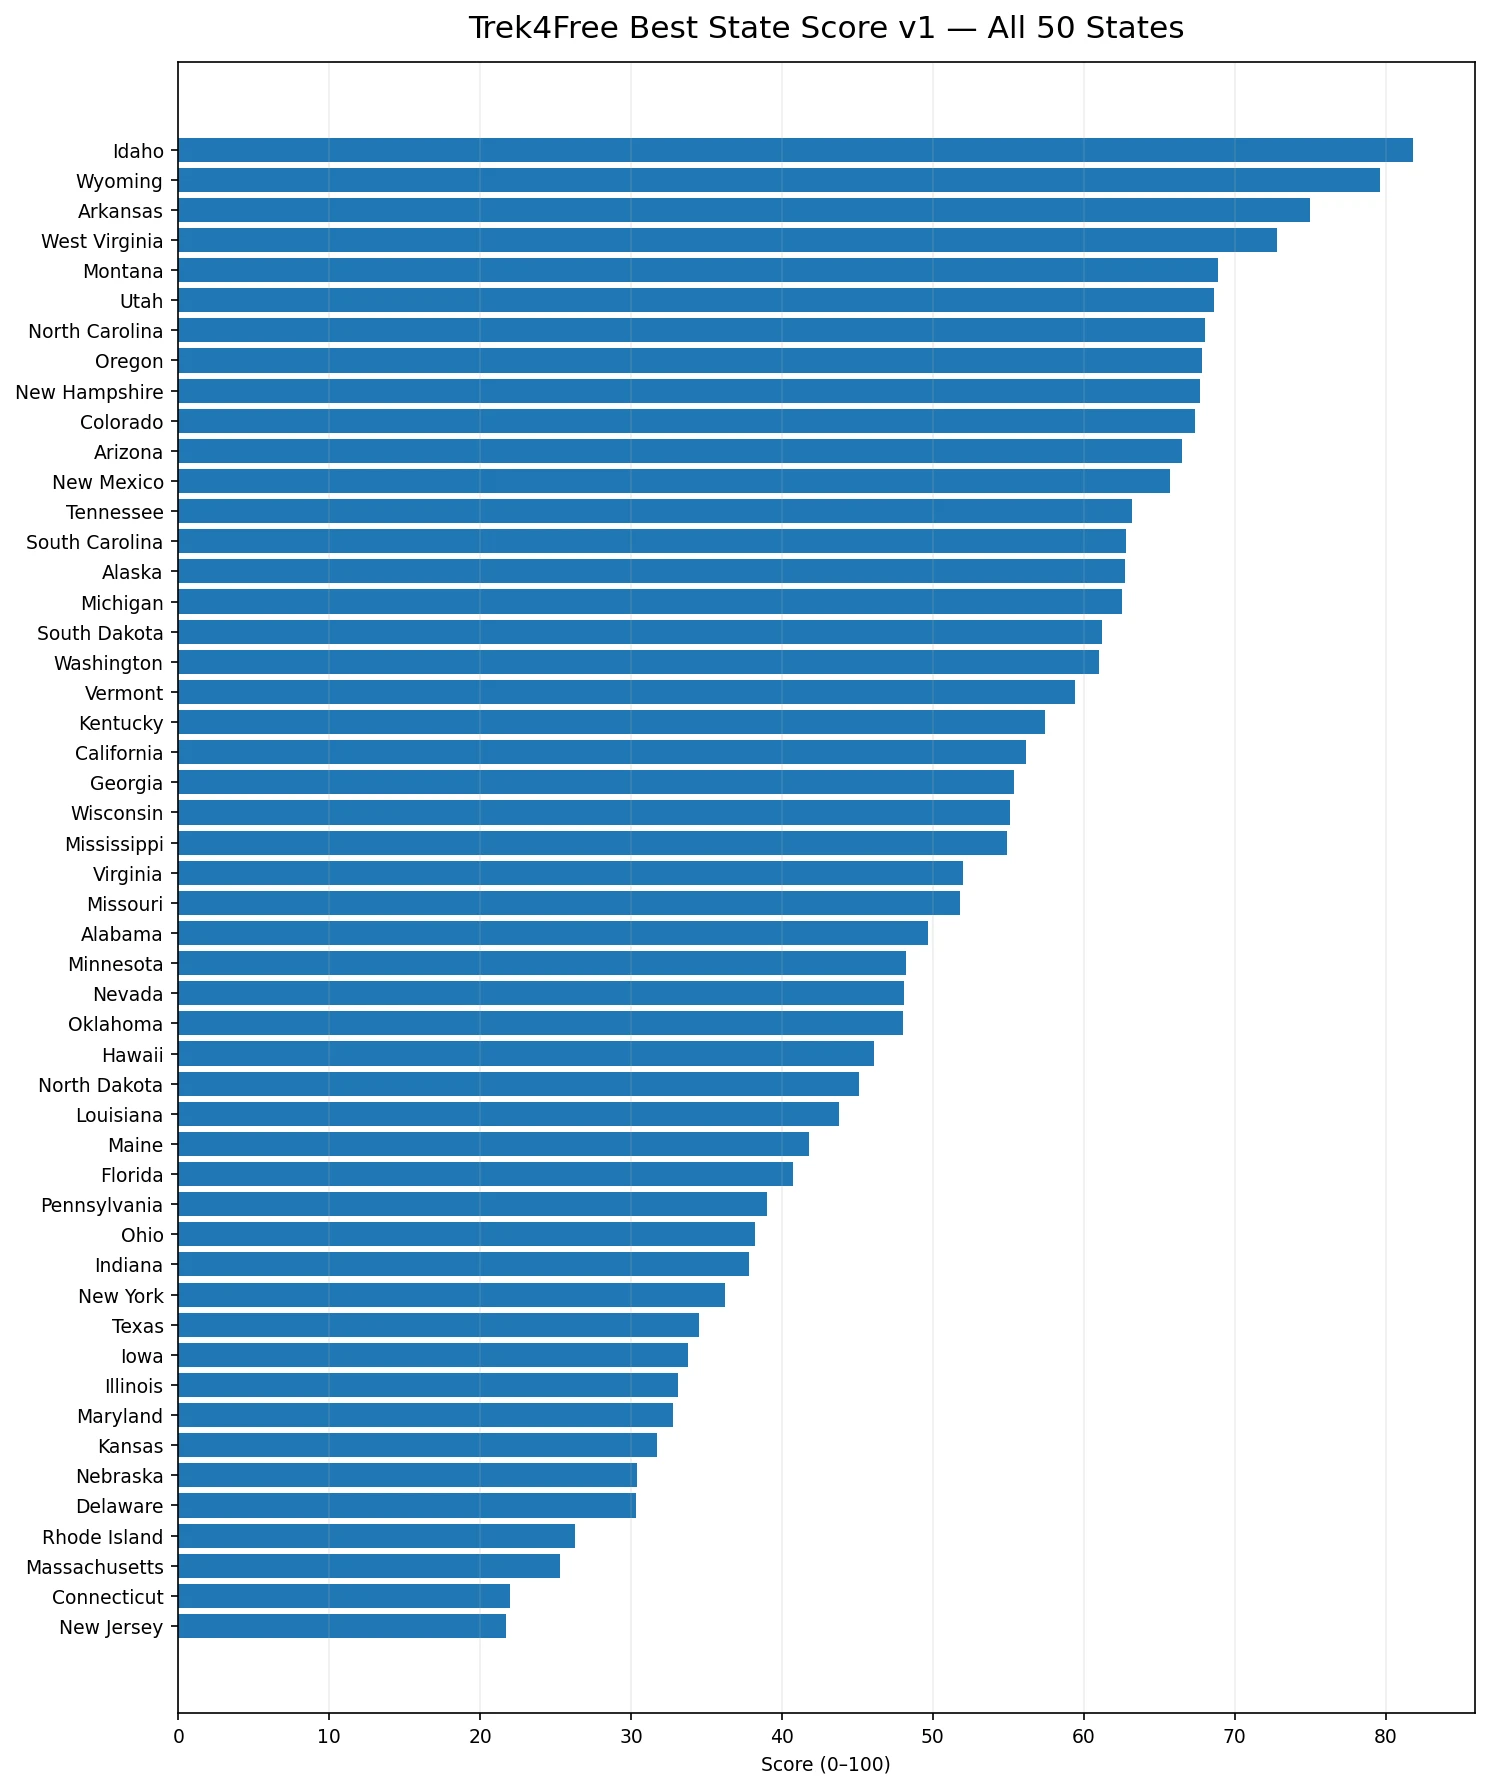
The middle of the pack matters too:
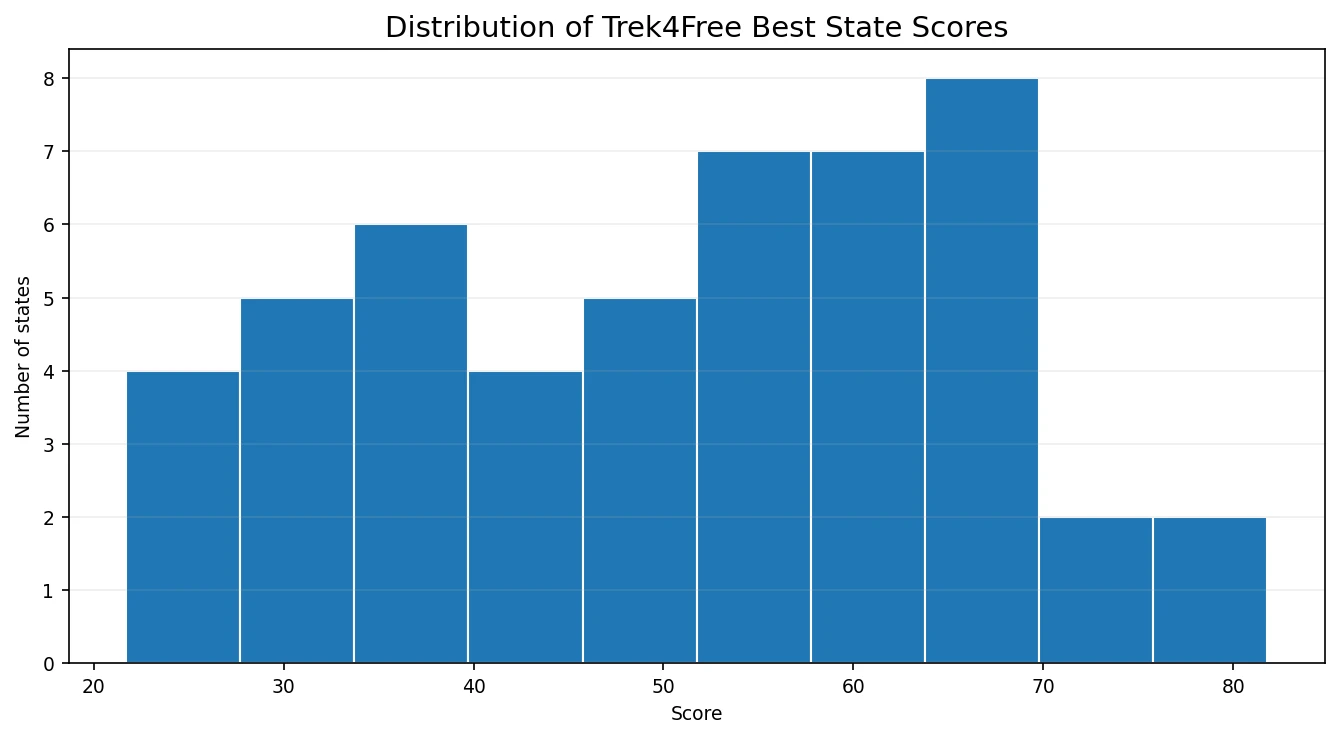
Most states cluster together instead of splitting cleanly into “good” and “bad” groups. That means small changes to the weighting could shuffle a lot of the middle ranks around — another reason to treat this as version one of a real, ongoing index rather than a final verdict.
Does Outdoor Access Actually Correlate With Obesity? Mostly, No.
This was one of my original questions going in, and I want to report the honest answer even though it isn’t the clean story I might have wanted.
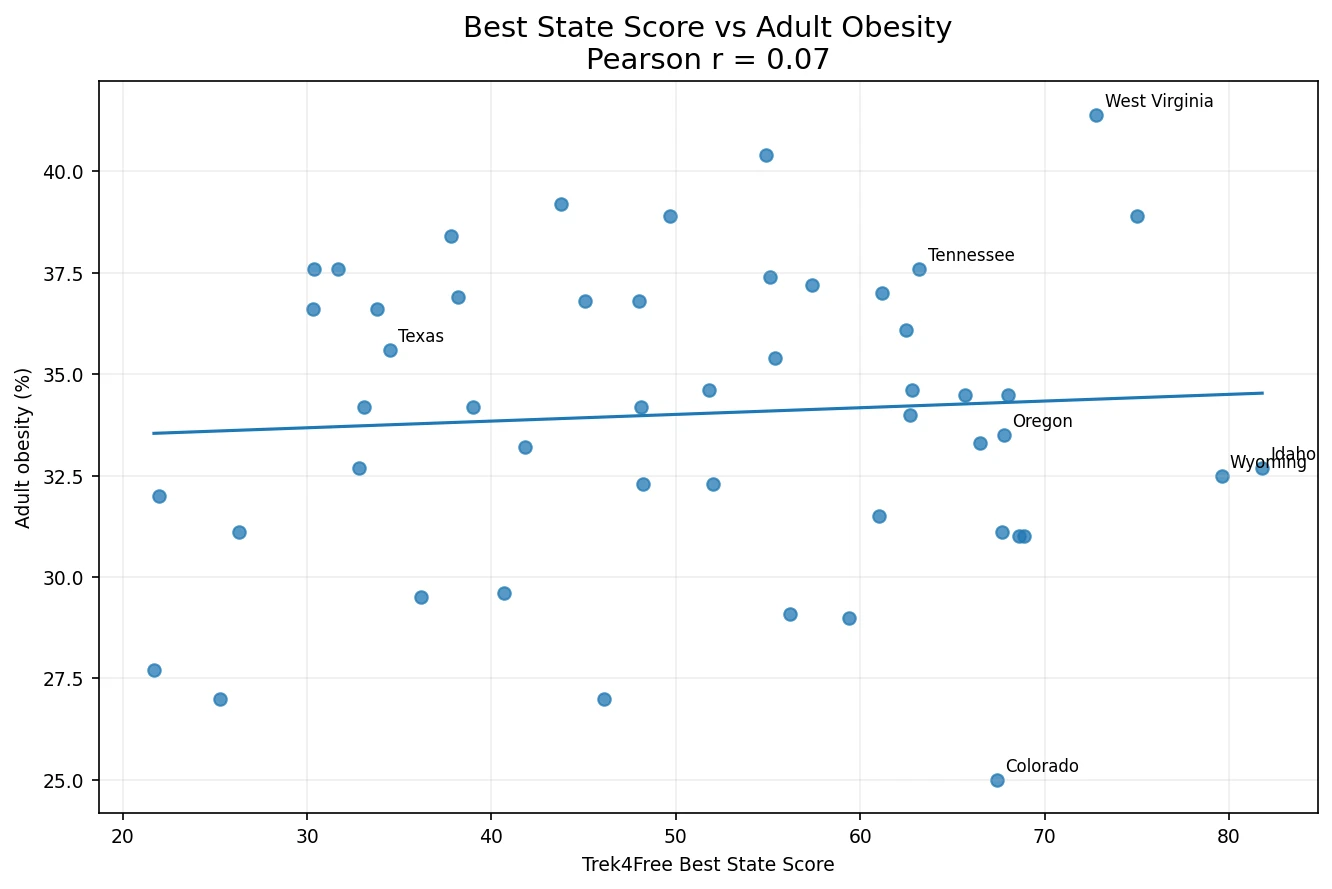
Across all 50 states, the correlation between the full Best State Score and adult obesity is essentially zero (r = 0.07). There’s a moderate negative relationship specifically between outdoor-opportunity density (opportunities per 1,000 square miles) and obesity (r ≈ -0.45) — worth watching — but it fades fast against other measures: public land alone is r ≈ -0.30, opportunities per capita is only r ≈ -0.20.
I’m not going to dress that up. The data does not support saying “states that are better for outdoor living have less obesity.” What it does suggest is something narrower: geographic density of nearby opportunity might matter in a way that simply having a lot of public land or a good affordability score doesn’t capture on its own. There are too many real confounders here — income, age, food environment, climate, culture, healthcare access — for a state-level correlation to prove anything about individual behavior. This is a lead worth investigating further, not a conclusion.
Public Land Doesn’t Mean Cheap Living, Either
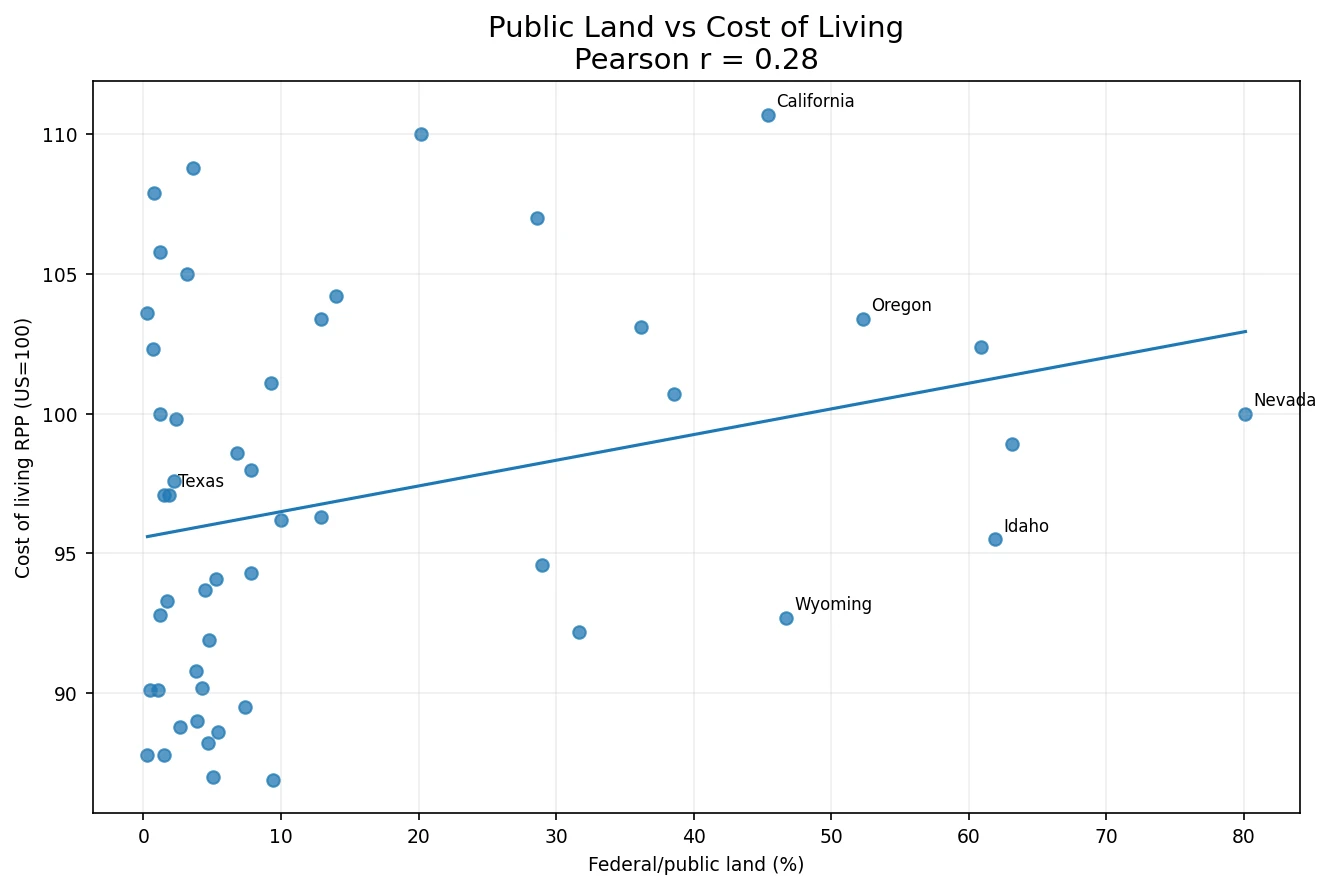
Some states have extraordinary public-land resources and are genuinely expensive places to put down roots. Others are cheap but offer comparatively little open landscape. A destination can be phenomenal for a one-week trip while being financially unrealistic as an actual home base — and a low-cost state can be easy to afford while requiring a lot more driving, planning, and reservation-wrangling to reach the good stuff. The “best” answer depends entirely on which question you’re actually asking.
Where This Goes Next
The current score is best understood as an outdoor-lifestyle value index — not a “best place to visit” ranking and not a definitive “best place to live” ranking either. Both of those deserve their own separate index eventually, weighted differently.
The one I actually want to build next is what I’d call the Freedom to Roam Index — an attempt to measure how easy it is to show up in a state and have an outdoor adventure without months of advance planning. Reservation requirements, permit friction, same-day site availability, entrance and camping fees, length-of-stay limits — the stuff that turns “I have public land” into “I can actually use it on a Friday afternoon.” That would turn the Texas observation above from an anecdote into something testable.
The Honest Limitations
A few things worth knowing before you screenshot the ranking and argue about your state in the comments:
- The underlying counts reflect Trek4Free’s own catalog, and a trailhead, a waterfall, a cave, and a campground are not equivalent experiences. Completeness may vary state to state.
- Public-land percentage is a proxy, not a guarantee. Different agencies and parcels carry very different access rules.
- These are state-level averages. Oregon’s statewide housing cost doesn’t describe every Oregon town — outdoor gateway towns can look completely different from the state number.
- Tennessee’s obesity figure is from 2023, not 2024, because an adequate current estimate wasn’t available. I flagged it rather than pretend it was current.
- The weights are a choice, not a law. A different organization asking a different question could reasonably weight this differently and get a different ranking. That’s not a flaw — it’s what an honest index looks like.
- None of these are causal claims. Correlation between state-level variables doesn’t prove that public land causes affordability, or that proximity to trails causes lower obesity, or that any single policy causes a state’s rank.
So — Where Does an Ordinary Person Actually Get to Live an Outdoor Life?
The real finding of this first pass isn’t “Idaho is objectively America’s best outdoor state.” It’s this:
America’s most famous outdoor states are not necessarily the states where outdoor adventure is most attainable.
Change the definition of “outdoor quality” and the map changes with it. Measure sheer abundance, one group wins. Measure it per resident, another group shows up. Add public land, the West gets much stronger. Add housing costs and taxes, some of the expensive icons lose ground and states like Arkansas and West Virginia become serious contenders nobody was talking about.
I still fall in love with every place I visit. That part of me isn’t going anywhere. But now, before I start pricing land in my head, I’ve got a real answer to check my gut against — and for once, it wasn’t the answer I expected.
Full dataset, methodology, and every chart shown here are available for anyone who wants to check the numbers themselves. This is version 1 of an ongoing project — expect it to get sharper as more variables (climate, income, access friction) get added.